

What is the Best Trading Timeframe? Understanding Timeframe Differences
Choosing a trading timeframe is more than just adjusting a chart; it’s a seemingly simple decision that significantly impacts your trading results. The timeframe you select influences your trading style, risk management strategy, and even the indicators you use. A timeframe represents the period over which each candle on the chart displays price movement:
Short timeframes: More excitement, quick entry and exit opportunities, but also more noise.
Long timeframes: Less noise, clearer trends, but fewer trading opportunities.
If you don’t choose the appropriate timeframe, your chances of making mistakes and experiencing fatigue increase. Therefore, it’s best to align your timeframe with your trading style and available time. Join Nima Imani’s site for more insights in this article.
Table of Content
- What is a Timeframe?
- Why is Using Multiple Timeframes Necessary?
- Timeframes and Trading Styles: A Trader’s Roadmap
- Expert Review of Common Timeframes (Advantages and Disadvantages)
- Multi-Timeframe Analysis (MTFA): The Key to Professional Trading
- Factors Affecting Timeframe Selection: Beyond the Chart
- Conclusion: The Best Timeframe is the One That Suits You

What is a Timeframe?
A timeframe, or price period, refers to the duration over which a price bar or candle is formed on a chart. This interval can range from one second to one year or even longer, depending on the available data. For example, if our timeframe is 5 minutes, each price bar represents the price changes within that 5-minute period. For a better understanding, see the image below.

(Image description: The image above shows the Bitcoin price chart against the dollar. As observed, the time interval or timeframe is set to 1 hour (1). This means each candle (red and green bars) represents price changes within one hour. You can also see in the image above that there are 12 minutes and 8 seconds remaining until the last candle closes (2).)
Essentially, a timeframe is a slice or segment of time that an analyst chooses to examine and analyze the behavior of a market or a currency. Generally, a timeframe determines two things for a trader:
- The level of risk in a trade.
- The duration it takes for a trader’s analysis and trade outcome to be determined.
For instance, if a trader uses a weekly timeframe, they bear significantly less risk, but they must wait several weeks to months to achieve profit and reach their target.
Conversely, if a trader analyzes and trades on a 1-minute timeframe, the trade outcome will be determined within minutes. However, this carries a very high risk, and it’s rare for a trader to analyze on a 1-minute timeframe.
Timeframes are not only tools for trend confirmation but are also very useful and practical for identifying critical levels. A resistance level observed for over a year on a daily chart is far more significant than a support level on a 5-minute chart that is only valid for a few hours.
If you trade daily and continuously, monitoring price movements across different timeframes is always beneficial, as it allows you to notice their consistency and alignment across various periods.
Sometimes, you might spot a suitable trading entry opportunity on a smaller timeframe, for example, the 5-minute chart. However, upon checking larger timeframes, you might realize that the price trend on the daily and hourly charts is in the opposite direction.
A trader can be considered successful if they strive to increase their winning trades. Furthermore, at a higher level, trading can be described entirely as a risk management game. Executing trades using multiple timeframes incorporates both aspects, as it first assures you that you are selecting options with a higher probability of winning, while simultaneously keeping you away from unnecessary trades against the market’s direction.
One important point to consider is that to trade on lower timeframes (like minute charts), you need higher decision-making power and speed. In contrast, on higher timeframes, you have more opportunity to observe details. Another point is maintaining proportionality between movements on different timeframes and aligning expectations for movements within each timeframe. Naturally, the potential price movement on a one-minute timeframe differs from that of a daily timeframe.
Why is Using Multiple Timeframes Necessary?
The use of multiple timeframes and continuous monitoring of them is essential for several primary reasons. These reasons include:
Gaining Confirmation
We’ve established that successful trading is linked to increasing winning trades and reducing their associated risks. Therefore, it’s wise to assess the Risk/Reward ratio before entering any trade. The ultimate goal is for profitable trades to significantly outweigh losing trades.
One way to increase the probability of winning trades is to confirm your trading strategy alongside price movements across several different timeframes. For example, if you spot a buy opportunity on the 15-minute timeframe, but the dominant trend identified on a higher timeframe is bearish, your trade’s probability of success decreases, and its risk increases. Consider the following chart, set to the 15-minute timeframe:
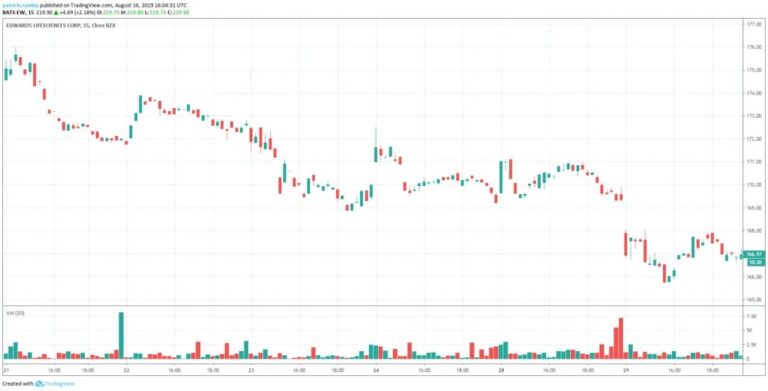
15 Min Time Frame Chart
(Chart Description: The chart clearly shows a downtrend in price. New lower highs and lower lows are consistently being made below previous ones. Additionally, the last downward price movement was accompanied by high volume. With low trading volume during the consolidation phase, a continuation of the downtrend can be inferred. For many traders, this presents an excellent opportunity to enter a short trade (profiting from a price decrease).)
However, if we were to switch to a higher timeframe, such as the weekly chart, our perspective might change.
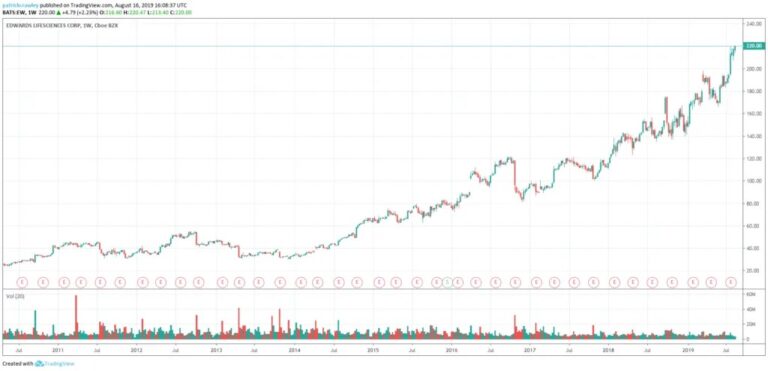
Weekly Time Frame Chart
(Chart Description: Looking at this chart, we see that the price has been in a very strong uptrend for several years. Institutions like mutual funds, hedge funds, and asset management companies are buying the company’s stock every month. Now, with this broader view, would you still be willing to enter a short trade? If you are a short-term investor, perhaps. But if you intend to invest long-term, based on the weekly timeframe, a price decrease should not be expected.)
Therefore, on higher timeframes, pursuing buy positions in this asset would be a more rational and cautious approach. This might seem obvious, but if we look back at our own trading history, have we confirmed price movements across multiple timeframes? If not, revisit some of your failed trades and see if you were fighting the trend in them.
Gaining a Different Perspective
Sometimes, a trader can become so engrossed in the fluctuations of a single timeframe that they forget what the chart looks like on another. Consequently, they might stare at the 5-minute chart all day and fail to notice a trend reversal on a larger timeframe.
What appears as an uptrend on an hourly chart might actually be the continuation of a long-term downtrend on the daily chart.
Occasionally, looking at multiple timeframes can completely alter a trader’s bias towards one. A trader might be looking for an entry point for a buy trade, but reviewing a different timeframe could shift their focus to a sell opportunity.
Allowing Trades to Develop
You may have heard of the Pareto Principle, or the 80/20 rule, or the law of the vital few. This fascinating principle is universal and generally states that “80% of the effects come from only 20% of the causes.” For example, in marketing, this principle suggests that only 20% of your customers generate 80% of your profit.
The Pareto Principle can also be applied to trading. Approximately 80% of profits stem from 20% of trades. If we examine our trading performance over a year, we’ll notice that a small number of significant trades are responsible for our primary gains or losses. Identifying these crucial 20% of trades can be vital for a trader. This falls under the umbrella of capital and risk management.
Using multiple timeframes is an excellent method for identifying those profitable 20% trades. Sometimes, a trading opportunity identified on a 1-minute or 5-minute timeframe might extend to larger timeframes. The breach of a resistance level on a 5-minute chart could evolve into a broken resistance on the hourly chart, ultimately leading to a breakout on the daily chart. The longer and larger these timeframes chain together, the greater the potential profit from the trade will naturally be, as breaking a daily level carries more significance than breaking an intraday level (like the hourly).
In such scenarios, you can enter the market even earlier than traders who initiate their trades by simply following the immediate trend. Consequently, these trades, which generate your highest annual profits, provide you with the opportunity to remain in the market for longer.
Identifying Crucial Levels
You might identify a level on a stock’s 5-minute chart that has repeatedly acted as support. By referring to higher timeframes, you can gauge the significance of this level and determine if it’s a key price zone or merely a short-term one.
Support and resistance levels are formed by the repeated buying and selling actions of traders at these price points. In many cases, it’s large financial institutions that are accumulating or liquidating their positions at these levels. The difference between a support level on a 5-minute chart and a similar level on a weekly chart will be quite apparent.
The following image shows the price chart of an asset in the 5-minute timeframe. At $177, we observe a significant resistance level.
(Image description: A 5-minute chart showing price action. A resistance level is marked at $177.)
Looking at the daily chart for the same asset, this resistance no longer appears to be a significant level.
(Image description: A daily chart of the same asset, showing that the $177 level is not a significant resistance in this timeframe.)
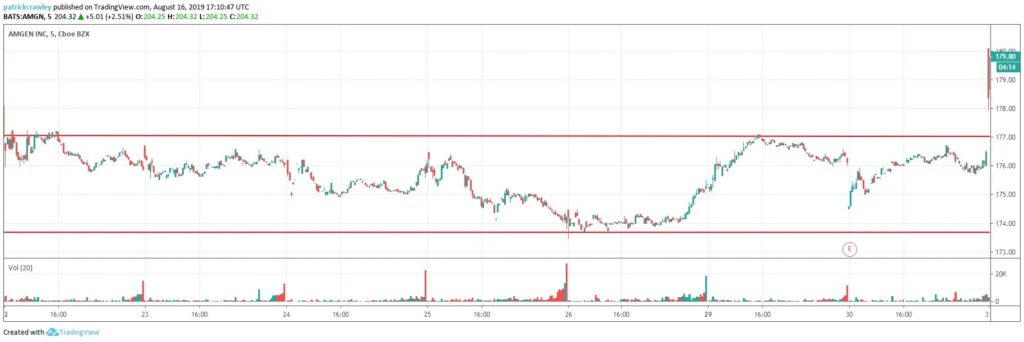
Daily Time Frame
How to Use Different Timeframes for Decision-Making
Let’s start with an example. Observing the price movements on the following 5-minute chart for Apple stock, you’ll notice the interplay between buyers and sellers.
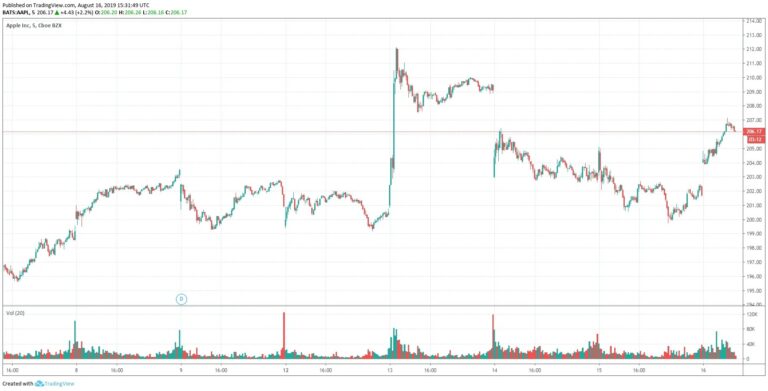
Buyers are attempting to push the price out of its channel, but trading volume doesn’t confirm this upward movement. Note the significant support ; any bounces from this level have been accompanied by low volume. A novice trader might enter the market on false breakouts above or below the $200 support.
However, we haven’t considered the bigger picture. A crucial principle is to apply small timeframes within the context of long-term price movements. Doing so allows us to enter trades with greater confidence. Even a glance at the hourly timeframe can offer a different perspective; consider the following chart.
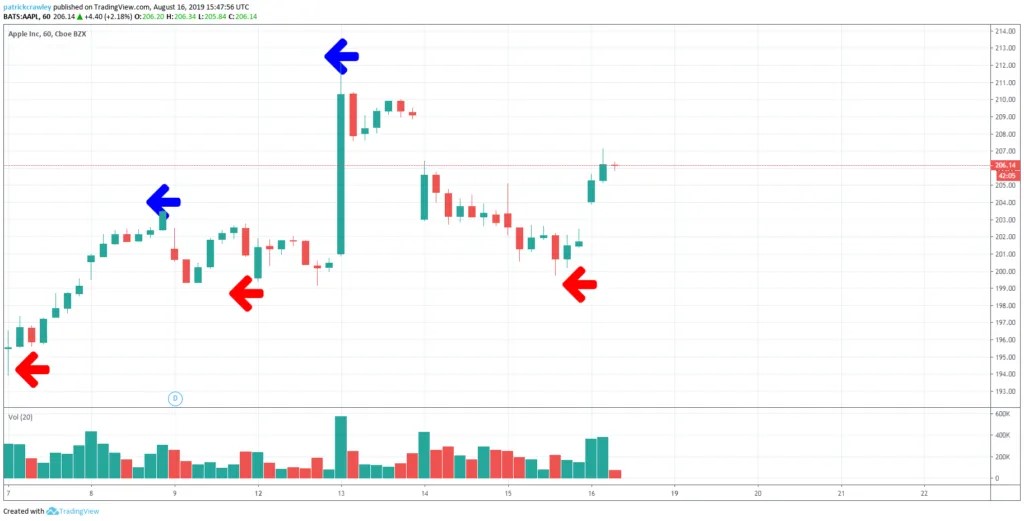
(Image description: A 1-hour chart showing Apple stock price action. It might illustrate higher highs and higher lows despite initial price fluctuations.)
False breakouts gain a different meaning on this timeframe. While initial price jolts might be occurring, the price is still making higher highs and higher lows (indicated by green and red arrows), signifying that the overall uptrend remains intact.
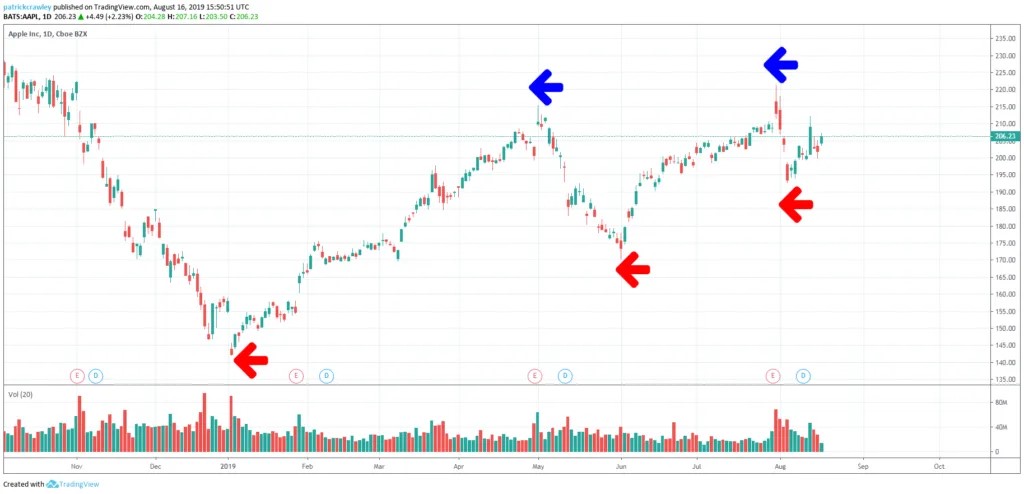
On the daily chart, we see that Apple’s stock price has been in an uptrend throughout 2019. Although it may not be the strongest uptrend, trading against it will likely not favor your probabilities.
Timeframes and Trading Styles: A Trader’s Roadmap
The relationship between a trader’s chosen timeframe and their trading style is direct and inseparable. Before selecting a chart, you must decide which of the following categories you wish to trade within:
- Scalping: Trading in Seconds and Minutes
- Goal: To profit from very small price movements (typically a few pips) and close trades in the shortest possible time (seconds to minutes).
- Primary Timeframes: 1-minute (M1), 5-minute (M5).
- Advantages: Very high number of trades, lower risk per trade (due to small stop-losses).
- Disadvantages: Requires constant and extremely high focus, extreme sensitivity to market noise and high commissions (due to high trade volume).
- Psychological Profile: Suitable for individuals with the ability for instant decision-making and high stress tolerance.
- Day Trading: Closing Positions Before Sunset
- Goal: To open and close all positions within the same trading day, avoiding overnight risks (e.g., news outside market hours).
- Primary Timeframes: 5-minute (M5), 15-minute (M15), 30-minute (M30).
- Advantages: Filters out 1-minute noise, opportunity to analyze price structure throughout the day, better risk management compared to scalping.
- Disadvantages: Requires dedicating at least a few consecutive hours per day, potential for larger losses per trade compared to scalping.
- Swing Trading: Capturing Short- to Medium-Term Trends
- Goal: To hold positions for several days to a few weeks to profit from short-term market fluctuations or trends.
- Primary Timeframes: 4-hour (H4), Daily (Daily).
- Advantages: Requires less monitoring time (checking a few times a day or once daily), opportunity for more rational decision-making, reduced trading commissions.
- Disadvantages: Overnight and weekend risks, larger stop-loss (Stop-Loss) requiring more precise capital management.
- Position Trading: Long-Term Investing
- Goal: To hold positions for weeks to months, or even years, based on fundamental analysis or very strong structural trends.
- Primary Timeframes: Weekly (Weekly), Monthly (Monthly).
- Advantages: Perfectly suited for those with limited time, minimal impact from market noise, negligible trading costs.
- Disadvantages: Requires immense patience and discipline, very large stop-loss amounts, gains are achieved slowly.

In-depth Analysis of Common Timeframes (Advantages and Disadvantages)
Each timeframe has unique characteristics, which are detailed in the following table:
| Timeframe | Main Use | Key Advantages | Key Disadvantages |
|---|---|---|---|
| 1 Minute (M1) | Scalping, ultra-fast entries/exits | Highest number of trading opportunities | Highest market noise, many false signals, high stress |
| 5 Minutes (M5) | Day trading, strategy execution | Good balance between speed and analysability | Requires high focus, market noise still noticeable |
| 15 Minutes (M15) | Day trading, intraday trend confirmation | Most popular timeframe for entries, shows stronger trends | Fewer trades compared to the 5-minute timeframe |
| 1 Hour (H1) | Long day trading, initial swing trading | Clearer price structure and support/resistance levels | Slower signals compared to shorter timeframes |
| 4 Hours (H4) | Swing trading, defining medium‑term trend | Filters noise significantly, more reliable signals | Requires larger capital to withstand volatility, fewer trades |
| Daily | Swing trading, position trading | Best timeframe for identifying the major trend | Suitable only for medium‑ or long‑term trading |
Multi-Time Frame Analysis (MTFA): The Key to Professional Trading
The difference between an amateur and a professional trader often lies in how they utilize timeframes. Professional traders never make decisions based solely on one timeframe; they employ Multi-Time Frame Analysis (MTFA).
MTFA means a trader uses three timeframes, each with a distinct function:
- Structural/Trend Timeframe (Longer TF)
- Goal: To determine the dominant market trend and map out key support and resistance levels.
- Selection: Typically the 4-hour or Daily timeframe.
- Rule: Only trade in the direction of the trend on this timeframe (e.g., if the daily trend is bullish, look for buying opportunities).
- Confirmation Timeframe (Intermediate TF)
- Goal: To zoom in on the trading zone to confirm the signal’s strength and avoid entering highly volatile areas.
- Selection: Typically the 1-hour or 15-minute timeframe.
- Execution/Entry Timeframe (Shorter TF)
- Goal: To pinpoint the most precise entry point for a trade and set the Stop-Loss and Take-Profit levels.
- Selection: Typically the 5-minute or 1-minute timeframe.
Practical Example (The Triple Rule):
- Daily Chart (Daily): You observe that the price is in a strong uptrend and has reached a key support level. (Decision: Look only for buys).
- 15-Minute Chart (M15): You notice the price forming a bullish reversal pattern and breaking a minor downtrend. (Confirmation: A buy signal is forming).
- 5-Minute Chart (M5): You wait for a strong bullish candle to form and then enter at the pattern’s breakout point. (Execution: Precise entry and exit point).
Factors Influencing Timeframe Selection: Beyond the Chart
A professional trader’s correct choice is not based solely on technical analysis; it is influenced by internal and external factors:
- Psychology and Stress Tolerance:
Shorter timeframes (1 and 5 minutes) impose significant psychological stress on a trader due to high noise and rapid decision-making. If you are someone who cannot make quick, high-risk decisions, then the 1-hour and 4-hour timeframes are more suitable, as they provide more time for thoughtful and rational market condition analysis.
- Capital and Risk Management (Stop-Loss):
Longer timeframes (4-hour and Daily) require larger stop-loss levels due to wider price fluctuations. This means you must have sufficient capital to withstand larger price movements, or significantly reduce your trade size to maintain a consistent risk percentage per trade (percentage of loss from the total account).
- Market Nature and Liquidity:
- High-Liquidity Markets (e.g., Major Forex Pairs): In these markets, noise on shorter timeframes is less pronounced, making Day Trading more feasible.
- Low-Liquidity Markets (e.g., Some Altcoins or Small-Cap Stocks): In these markets, short-term price volatility is very high, and signals are often strongly false. In such cases, one should resort to 1-hour and 4-hour timeframes to filter out noise.
- Trader’s Available Time:
If you have a full-time job and only a few hours in the evening or early morning, you should absolutely not consider scalping or Day Trading. Swing Trading, using the 4-hour or Daily timeframes which require less monitoring, would be your logical choice.

Conclusion: The Best Timeframe is the One That Matches You
In conclusion, it must be emphasized that there is no single, magical timeframe for all traders and all markets. The best timeframe is the one that aligns with your:
- Trading style (Day Trading, Swing, Scalping)
- Personality and psychological capacity (stress tolerance and decision-making speed)
- Available capital (ability to manage larger stop-losses)
- Daily free time
As a practical starting point for the majority of novice to intermediate traders interested in Day Trading, the combination of the Daily timeframe for structural trend + 15-minute for confirmation + 5-minute for precise entry is considered a safe and robust strategy.
Always remember that success in the market is not the result of using one timeframe, but rather the outcome of discipline and the correct execution of a multi-timeframe analysis strategy.
Similar articles you need to read: